
How to Read Financial Charts Like a Pro (and Spot High-ROI Opportunities)
How to Read Financial Charts Like a Pro (and Spot High-ROI Opportunities)
If you’ve ever stared at a stock, crypto, or forex chart and thought, “What am I even looking at?” — you’re not alone. Financial charts can look overwhelming at first, but once you learn how to read charts like a pro, you’ll start spotting trends, opportunities, and high-ROI setups like a seasoned investor.
In this guide, we’ll walk you through the basics and beyond. You’ll learn the key elements of reading charts, how to interpret price movements, and how platforms like Aligned Trades use automated AI to help investors trade smarter — without needing to master charting yourself.
Why Learn to Read Charts Like a Pro?
Understanding charts helps you:
- 📈 Spot trends early (before the crowd jumps in)
- 💸 Avoid risky entries and fake breakouts
- 📊 Make informed investment decisions backed by data
- 🚀 Identify high-ROI trades and long-term entry points
Whether you’re trading manually or just want to understand what your AI tools are doing, learning to read charts like a pro adds a major advantage to your investment game.
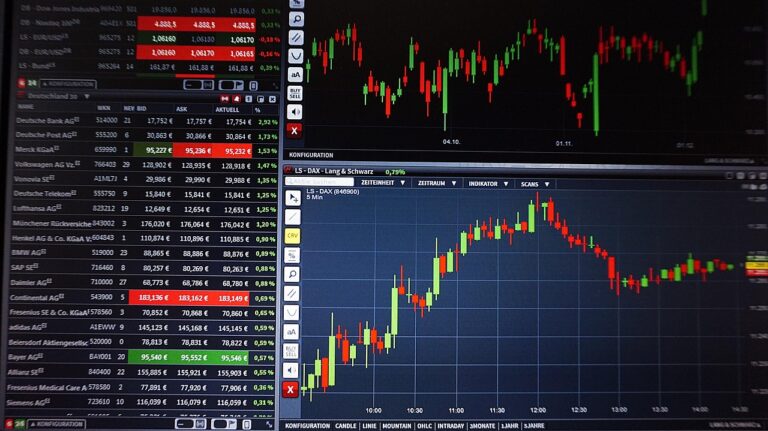
The Anatomy of a Financial Chart
Before you can analyze a chart, you need to know what you’re looking at. Most platforms — including those for crypto, stocks, or forex — use similar visual setups.
1. Time Frame
This shows how much time each “candle” or bar represents. It can be 1 minute, 5 minutes, 1 day, 1 week, etc. Longer timeframes give better big-picture trends; shorter ones are used for fast trades.
2. Candlestick Patterns
Candlesticks display the open, close, high, and low of an asset’s price within a specific time. Learning these patterns helps you predict future price moves.
- Green (bullish) candle: Price closed higher than it opened.
- Red (bearish) candle: Price closed lower than it opened.
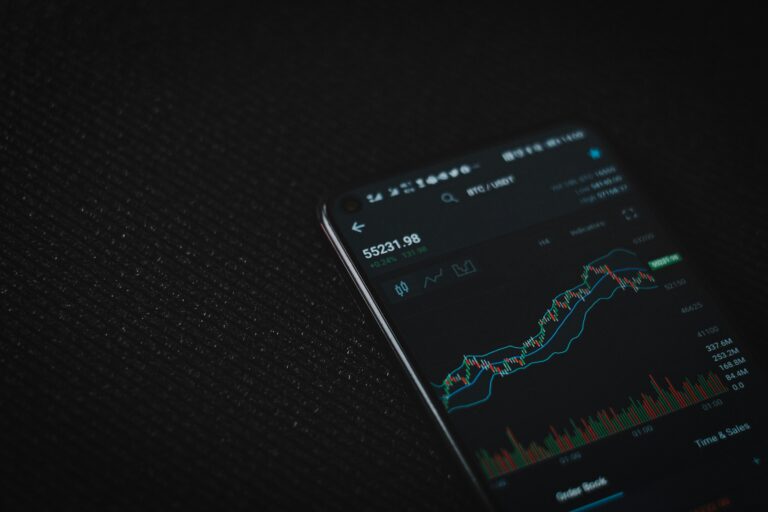
3. Volume
Volume shows how many units were traded in a time period. High volume during a breakout often confirms the strength of a move.
4. Trendlines and Support/Resistance
Trendlines help you understand the direction of the market. Support and resistance zones indicate where price tends to bounce or stall.
Key Chart Patterns to Know
Here are some classic chart patterns pros watch for when spotting high-ROI setups:
- 🔺 Ascending Triangle: Indicates bullish continuation.
- 🔻 Descending Triangle: Often signals a bearish breakdown.
- 🔄 Double Bottom: Reversal pattern that signals bullish momentum.
- ⬆️ Breakouts: When price moves beyond support/resistance with volume.
Learning to recognize these patterns early is what helps you trade like a pro — and identify optimal entry points.
Indicators That Help You Trade Charts Like a Pro
Alongside patterns, technical indicators give more insight into price momentum and potential reversals. Here are 3 that every chart-savvy investor should know:
1. Moving Averages (MA)
These smooth out price data to help identify the overall trend. Common ones include the 50-day and 200-day moving average.
2. RSI (Relative Strength Index)
RSI shows whether an asset is overbought or oversold — ideal for timing entries and exits.
3. MACD (Moving Average Convergence Divergence)
This momentum indicator helps confirm trend direction and changes in momentum.
By combining indicators with price action, you can trade with more confidence and precision.
Short on Time? Let Aligned Trades Read Charts For You
Reading charts like a pro takes practice. But if you don’t have time to study every candle and indicator, there’s good news — technology can do the heavy lifting.
Aligned Trades uses advanced AI algorithms to scan charts, identify high-ROI opportunities, and execute trades for you. It’s like having a team of expert chart analysts working around the clock — except it’s all automated.
With Aligned Trades, you can:
- 🤖 Automatically detect trends and breakouts
- 📊 Enter and exit trades with AI-precision
- 📈 Earn daily ROI with zero technical analysis required
- 💡 Learn by watching real-time chart actions in your dashboard
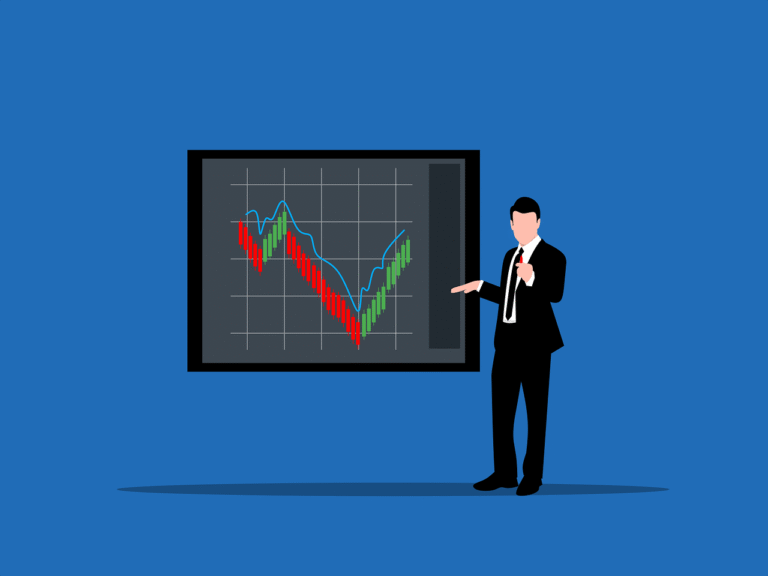
Real-Life Example: Spotting a Bullish Breakout
Let’s say Bitcoin has been trading inside a triangle for weeks. Suddenly, it breaks above resistance with a large green candle — and volume spikes. This is a textbook breakout signal.
A pro would identify this early, enter the trade, and ride the momentum upward.
Now imagine having an AI like Aligned Trades that spots this exact setup instantly and enters the trade without hesitation. That’s the power of blending human strategy with automated execution.
Tips to Improve Your Chart Reading Skills
Want to master charts like a pro? Here’s how:
- Practice daily: Spend 10–15 minutes studying charts every day.
- Use simulation tools: Practice trades with no real money at risk.
- Focus on 2–3 indicators: Don’t overwhelm yourself with too many tools.
- Follow trends, not feelings: Let the chart tell the story.
- Combine with AI: Platforms like Aligned Trades can confirm your analysis or handle it all for you.
Conclusion: Mastering the Chart, Maximizing ROI
Learning to read charts like a pro doesn’t have to be overwhelming. Start small, learn the basics, and build from there. The more you study, the more patterns and profitable opportunities you’ll begin to notice.
And if you’re looking for an edge in 2025’s fast-paced market, let Aligned Trades help you trade smarter. Whether you’re new to charts or already skilled, their automated trading platform gives you the power of chart analysis — without the stress.
💡 Want pro-level trading without chart fatigue?
Get started with Aligned Trades today!